|
Dr. Jan M. Ruijter trained as a medical biologist and worked in endocrinology, neurobiology, ophthalmology and embryology. In 2017 he retired from his position as principle investigator in the department of Medical Biology (Amsterdam UMC, location AMC, Amsterdam, the Netherlands) where he was heading a research group studying the relation between gene expression and the development of the heart with molecular, image analysis and 3D-reconstruction techniques.
The statistical analysis of research data resulted in the development of LinRegPCR, a program for the analysis of quantitative PCR data based on parameters derived from individual amplification curves, and Factor-qPCR, a program to remove between-plate variation in a multi-plate qPCR experiment (both available from http://LinRegPCR.nl). A survey of amplification curve analysis programs showed that LinRegPCR is among the most sensitive and reproducible methods. LinRegPCR imports raw fluorescence data, performs baseline correction and reports efficiency-corrected target quantities based on the mean PCR efficiency per target; its compatibility with Excel and RDML places the program in a pipeline between the qPCR apparatus and final statistical analysis. Jan is still involved in several advanced qPCR courses and is working on papers on PCR artefacts and efficiency-corrected data analysis. |

|
Dr Jan Ruijter's presentations will include:
Presentation 1.
Reported Cq and delta-Cq values cannot be interpreted.
Jan M Ruijter, Department of Medical Biology, Amsterdam UMC, location AMC, Amsterdam, the Netherlands
With the introduction of quantitative PCR (qPCR) it was assumed that the amplification efficiency, the fold-increase per cycle, was always close to 2. This simplification allowed the use of the so-called comparative Cq equation to calculate the fold-difference between target and reference genes in treated and control tissues. Over the years, parts of the original equation have been lost and currently ‘ddCq’ seems to be the unit in which qPCR data are measured and have to be reported.
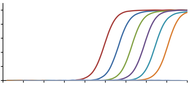
The Cq value is defined as the position of the amplification curve with respect to the cycle-axis and is assumed to be a measure for the initial target quantity: the ‘later’ the curve, the higher the Cq value and the lower the starting quantity of the target-of-interest. However, this position is also dependent on the amplification efficiency: lower efficiency results in a later curve. Reported Cq and dCq values can only be interpreted with the simplifying, and false, assumption that every PCR assay in the experiment is 100% efficient. The interpretation of reported Cq values therefore unavoidably leads to an unknown bias.
The bias that is introduced by ignoring the actual PCR efficiencies of target and reference genes can be prevented with the calculation of the so-called efficiency-corrected target quantities or fold-differences. This was already proposed in the early years of this millennium and is recommended in the MIQE guidelines. However, determining the required PCR efficiency is hampered by systematic pipetting errors in the dilution series used for constructing the so-called standard curve: less dilution gives more input with lower Cq values and thus a shallower standard curve from which a biased higher efficiency is calculated.
The need for proper efficiency-correction of qPCR results is still largely ignored by researchers as well as reviewers and publishers. This common shortcoming of the PCR research community may be the main reason for the limited reproducibility of reported qPCR results. This presentation will show how large the bias in reported qPCR results can be and how these errors can be avoided.
Presentation 2:
Removal of artifact bias from qPCR results using DNA melting curve analysis
Jan M Ruijter, Department of Medical Biology, Amsterdam UMC, location AMC, Amsterdam, the Netherlands
Quantitative PCR (qPCR) allows the precise measurement of DNA concentrations and is generally considered to be straightforward and trouble free. However, analyses using validated SYBR Green I-based assays regularly amplify both the correct product and an artifact. When the PCR also amplifies an artifact, the threshold will be reached at an earlier cycle and the quantification will be biased. Moreover, artifact amplification in clinical assays can lead to wrong diagnosis.
Amplification of more than one product can be recognized when melting curve analysis is performed after the qPCR. Currently, such reactions need to be excluded from further analysis because the quantification result is considered meaningless. However, when the fraction of the fluorescence associated with the correct product can be determined, the quantitative result of the qPCR analysis can be corrected.
The main assumptions of this correction model are 1) the melting peak of the correct product can be identified, 2) the PCR efficiencies of all amplified products are similar, 3) the relative size of the melting peaks reflects the relative concentrations of the products and 4) the relative concentrations do not change as the reaction reaches the plateau. These assumptions were validated in a series of model experiments.
The results show that the fraction of fluorescence associated with the correct product can then be used to correct the observed quantification result (Cq value or target quantity). Because off-target reactions are rescued, the statistical analysis of the data will be more powerful and, more importantly, wrong clinical diagnosis are avoided. Implementation of this correction for the presence of artifact amplification in the pipeline for analysis of qPCR data leads to more reliable quantitative results in qPCR experiments.
Acknowledgement: This research was performed in collaboration with Maurice van den Hoff and Quinn Gunst (Amsterdam UMC, Amsterdam, the Netherlands), Adrian Ruiz-Villalba (University of Navarra, Pamplona, Spain) and Carl Wittwer (University of Utah Health Sciences Center, Salt Lake City, UT, USA)
Presentation 1.
Reported Cq and delta-Cq values cannot be interpreted.
Jan M Ruijter, Department of Medical Biology, Amsterdam UMC, location AMC, Amsterdam, the Netherlands
With the introduction of quantitative PCR (qPCR) it was assumed that the amplification efficiency, the fold-increase per cycle, was always close to 2. This simplification allowed the use of the so-called comparative Cq equation to calculate the fold-difference between target and reference genes in treated and control tissues. Over the years, parts of the original equation have been lost and currently ‘ddCq’ seems to be the unit in which qPCR data are measured and have to be reported.
The Cq value is defined as the position of the amplification curve with respect to the cycle-axis and is assumed to be a measure for the initial target quantity: the ‘later’ the curve, the higher the Cq value and the lower the starting quantity of the target-of-interest. However, this position is also dependent on the amplification efficiency: lower efficiency results in a later curve. Reported Cq and dCq values can only be interpreted with the simplifying, and false, assumption that every PCR assay in the experiment is 100% efficient. The interpretation of reported Cq values therefore unavoidably leads to an unknown bias.
The bias that is introduced by ignoring the actual PCR efficiencies of target and reference genes can be prevented with the calculation of the so-called efficiency-corrected target quantities or fold-differences. This was already proposed in the early years of this millennium and is recommended in the MIQE guidelines. However, determining the required PCR efficiency is hampered by systematic pipetting errors in the dilution series used for constructing the so-called standard curve: less dilution gives more input with lower Cq values and thus a shallower standard curve from which a biased higher efficiency is calculated.
The need for proper efficiency-correction of qPCR results is still largely ignored by researchers as well as reviewers and publishers. This common shortcoming of the PCR research community may be the main reason for the limited reproducibility of reported qPCR results. This presentation will show how large the bias in reported qPCR results can be and how these errors can be avoided.
Presentation 2:
Removal of artifact bias from qPCR results using DNA melting curve analysis
Jan M Ruijter, Department of Medical Biology, Amsterdam UMC, location AMC, Amsterdam, the Netherlands
Quantitative PCR (qPCR) allows the precise measurement of DNA concentrations and is generally considered to be straightforward and trouble free. However, analyses using validated SYBR Green I-based assays regularly amplify both the correct product and an artifact. When the PCR also amplifies an artifact, the threshold will be reached at an earlier cycle and the quantification will be biased. Moreover, artifact amplification in clinical assays can lead to wrong diagnosis.
Amplification of more than one product can be recognized when melting curve analysis is performed after the qPCR. Currently, such reactions need to be excluded from further analysis because the quantification result is considered meaningless. However, when the fraction of the fluorescence associated with the correct product can be determined, the quantitative result of the qPCR analysis can be corrected.
The main assumptions of this correction model are 1) the melting peak of the correct product can be identified, 2) the PCR efficiencies of all amplified products are similar, 3) the relative size of the melting peaks reflects the relative concentrations of the products and 4) the relative concentrations do not change as the reaction reaches the plateau. These assumptions were validated in a series of model experiments.
The results show that the fraction of fluorescence associated with the correct product can then be used to correct the observed quantification result (Cq value or target quantity). Because off-target reactions are rescued, the statistical analysis of the data will be more powerful and, more importantly, wrong clinical diagnosis are avoided. Implementation of this correction for the presence of artifact amplification in the pipeline for analysis of qPCR data leads to more reliable quantitative results in qPCR experiments.
Acknowledgement: This research was performed in collaboration with Maurice van den Hoff and Quinn Gunst (Amsterdam UMC, Amsterdam, the Netherlands), Adrian Ruiz-Villalba (University of Navarra, Pamplona, Spain) and Carl Wittwer (University of Utah Health Sciences Center, Salt Lake City, UT, USA)
Selected qPCR Bibliography:
1. Ramakers, C., Ruijter, J.M., Lekanne Deprez, R.H. and Moorman, A.F.M. (2003) Assumption-free analysis of quantitative real-time polymerase chain reaction (PCR) data. Neurosci.Lett., 339, 62-66.
2. Ruijter, J.M., Ramakers, C., Hoogaars, W.M., Karlen, Y., Bakker, O., van den Hoff, M.J. and Moorman, A.F. (2009) Amplification efficiency: linking baseline and bias in the analysis of quantitative PCR data. Nucleic Acids Res., 37, e45.
3. Ruijter, J.M., Pfaffl, M.W., Zhao, S., Spiess, A.N., Boggy, G., Blom, J., Rutledge, R.G., Sisti, D., Lievens, A., De Preter, K. et al. (2013) Evaluation of qPCR curve analysis methods for reliable biomarker discovery: Bias, resolution, precision, and implications. Methods, 59, 32-46.
4. Ruijter, J.M., Lorenz, P., Tuomi, J.M., Hecker, M. and van den Hoff, M.J. (2014) Fluorescent-increase kinetics of different fluorescent reporters used for qPCR depend on monitoring chemistry, targeted sequence, type of DNA input and PCR efficiency. Mikrochim.Acta, 181, 1689-1696.
5. Ruijter, J.M, A. Ruiz-Villalba, J. Hellemans and A. Untergasser (2015). Removal of between-run variation in a multi-plate qPCR experiment. Biomol Detect Quantif 5. 10-14.
6. De Ronde, M.W.J., J.M. Ruijter, D. Lanfeard, A. Bayes-Genise, M.G.M. Kok, E.E. Creemers, Y.M. Pinto, S-J. and Pinto-Sietsma (2017). Practical data handling pipeline improves performance of qPCR-based circulating miRNA measurements. RNA 23. 811-821.
7. Ruiz-Villalba A, A. Mattiotti, Q.D. Gunst, S. Cano-Ballesteros, M.J. van den Hoff, and J.M. Ruijter (2017). Reference genes for gene expression studies in the mouse heart. Scientific Reports 7. e24.
8. Ruiz-Villalba, A., E. van Pelt-Verkuil, Q.D. Gunst, J.M Ruijter, and M.J. van den Hoff (2017) Amplification of nonspecific products in quantitative polymerase chain reactions (qPCR). Biomol Detect Quantif 14. 7-18.
9. Ruijter JM, Ruiz-Villalba A, van den Hoff AJJ, Gunst QD, Wittwer CT, van den Hoff MJB (2019). Removal of artifact bias from qPCR results using DNA melting curve analysis. FASEB J. 33. 14542-14555.

|
|
|

|
"qPCR & dPCR Under The Microscope" Symposium 2020
is managed by Gene Target Solutions. Ph: (02) 8090 2675. [email protected]